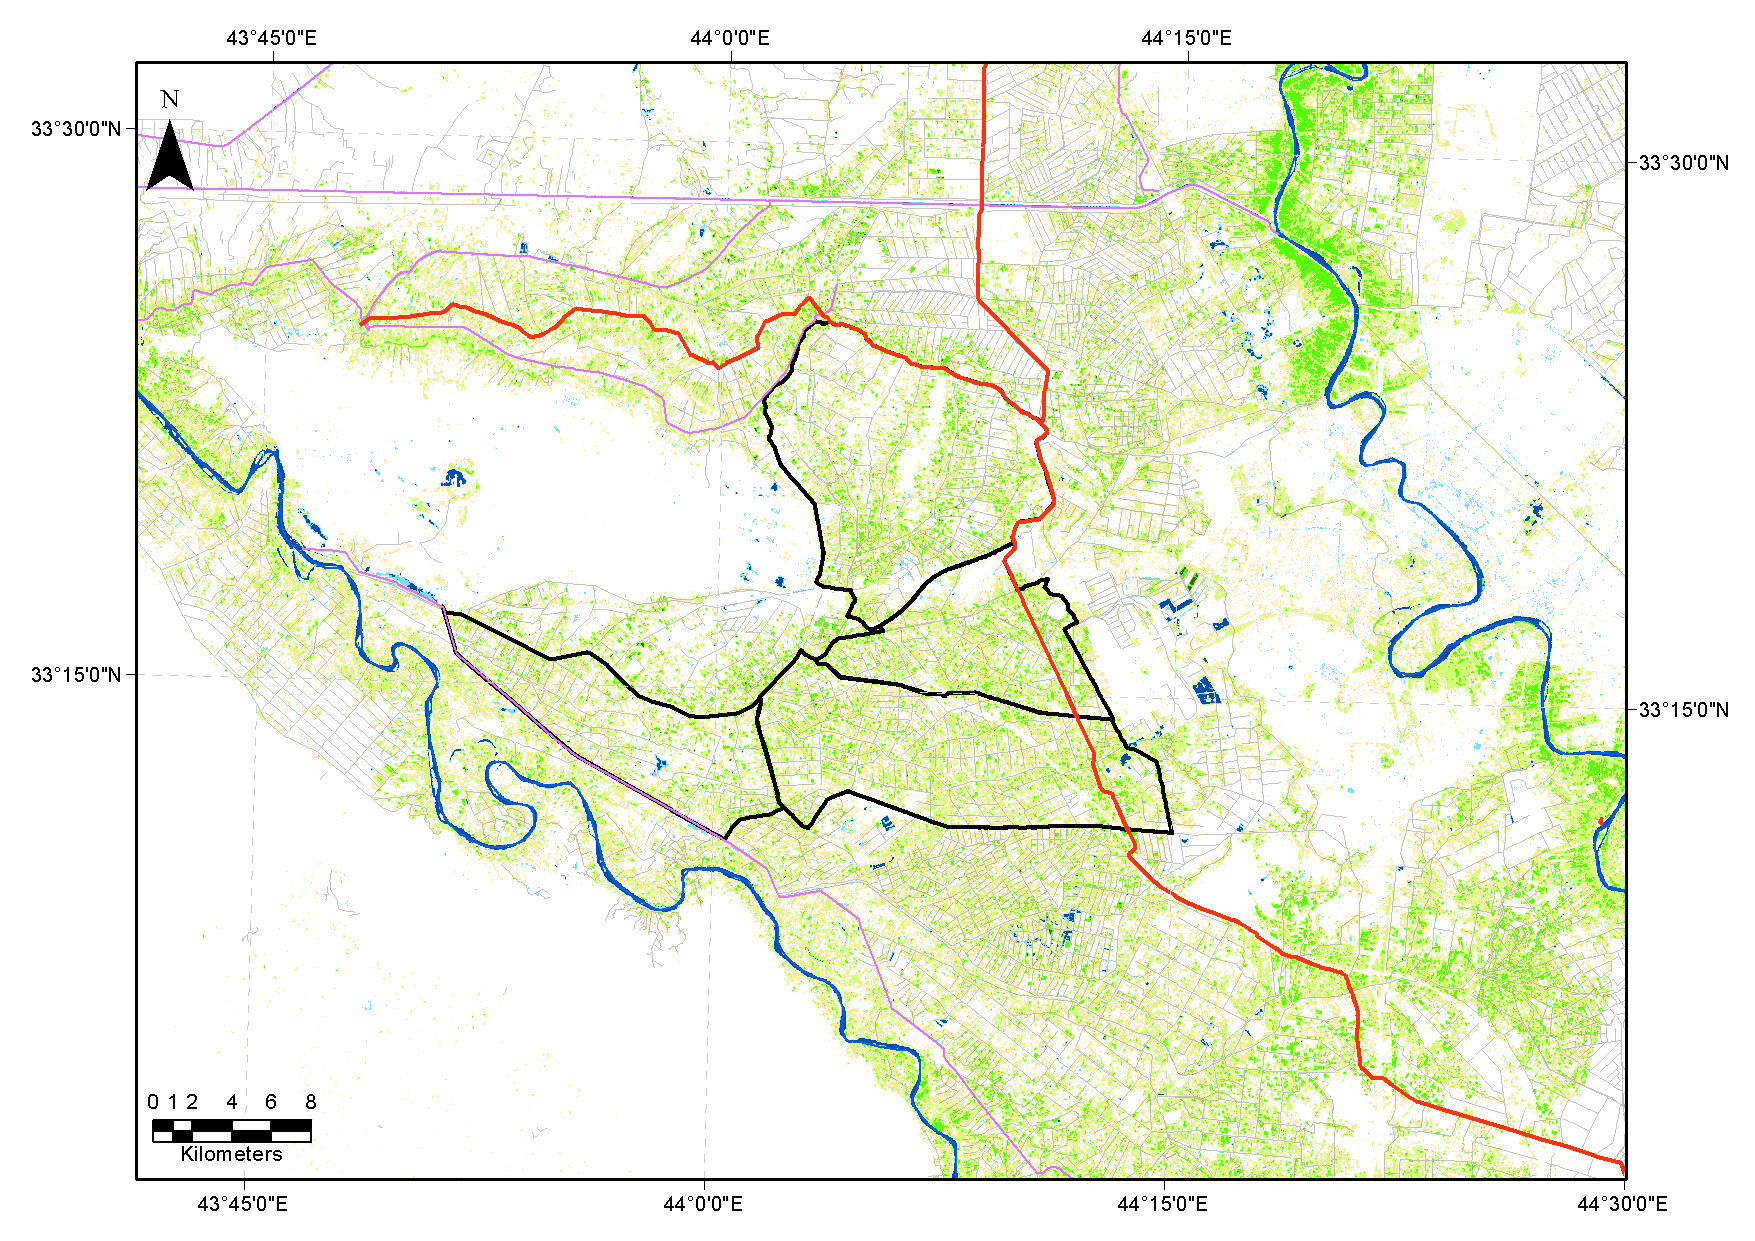
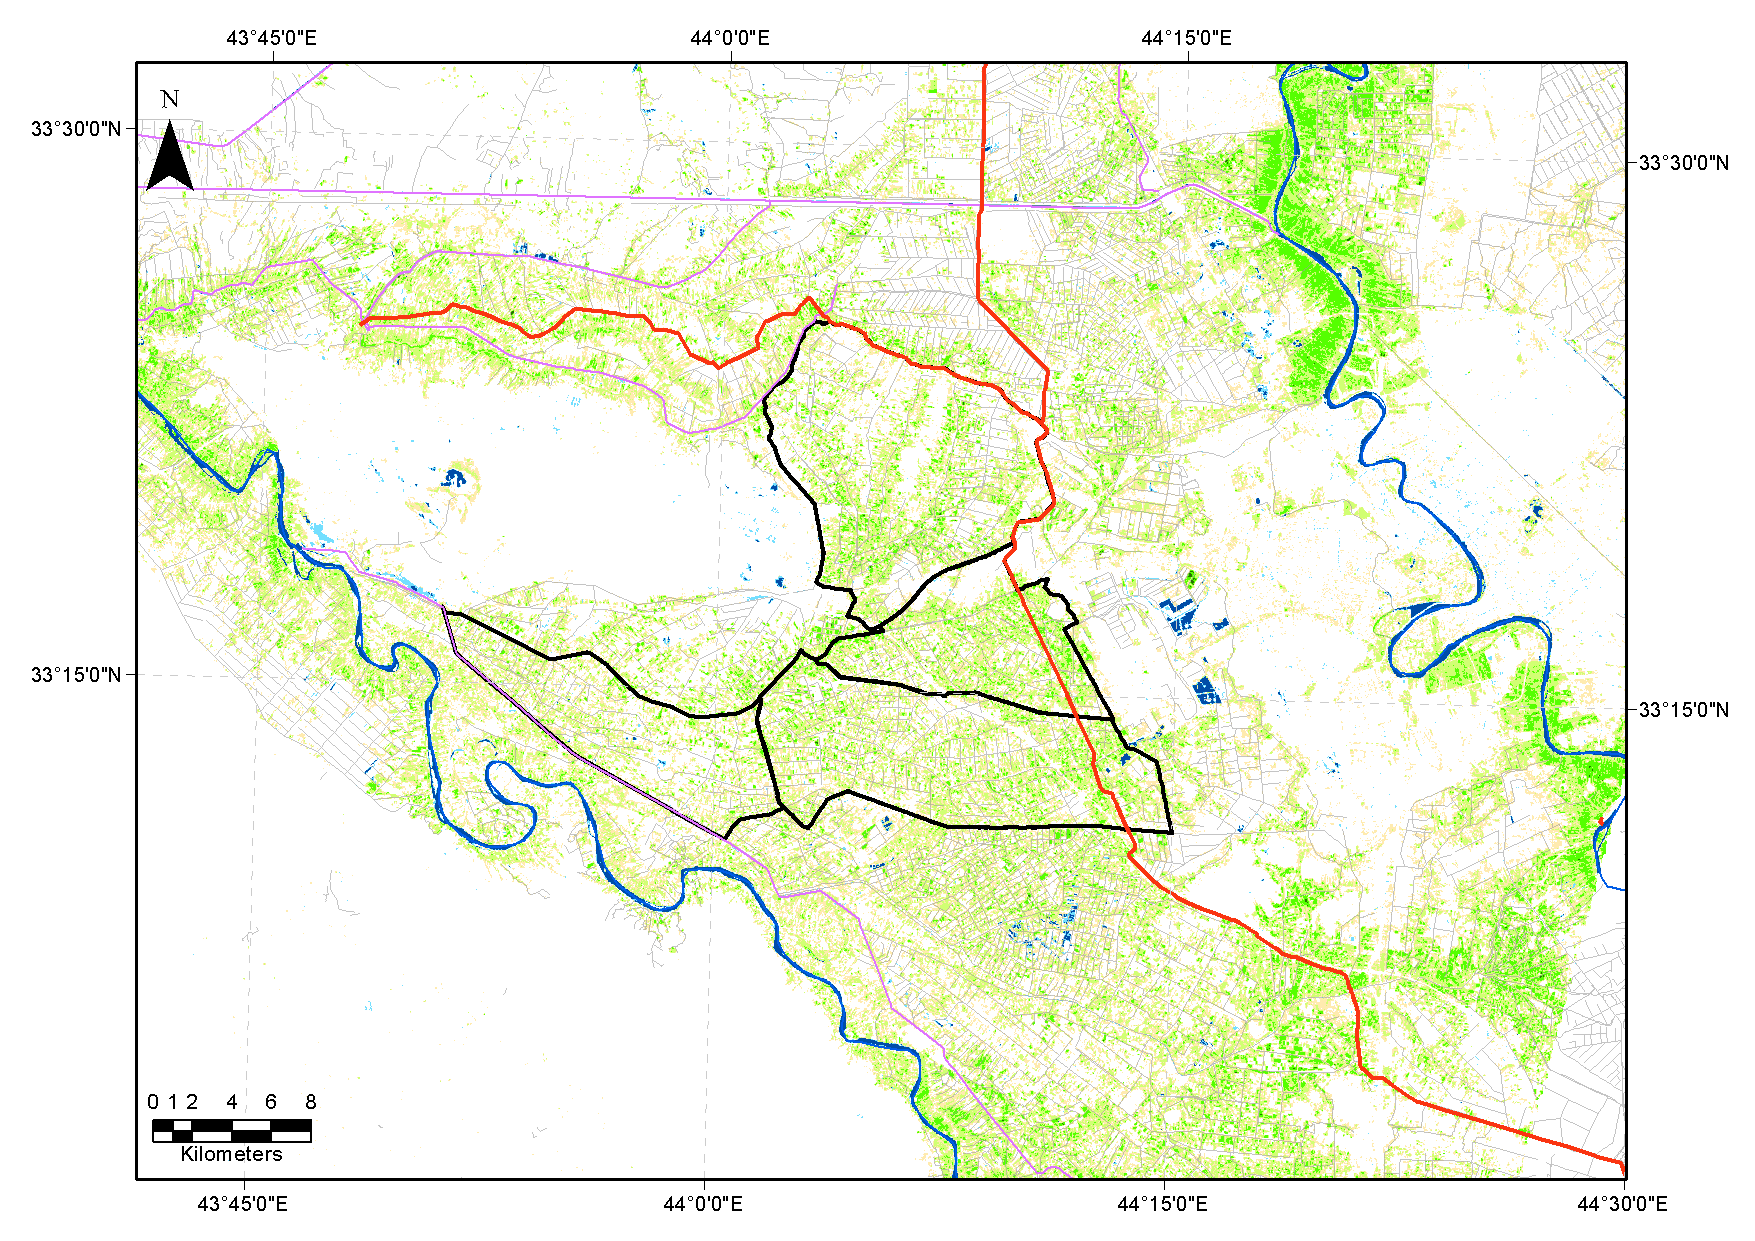
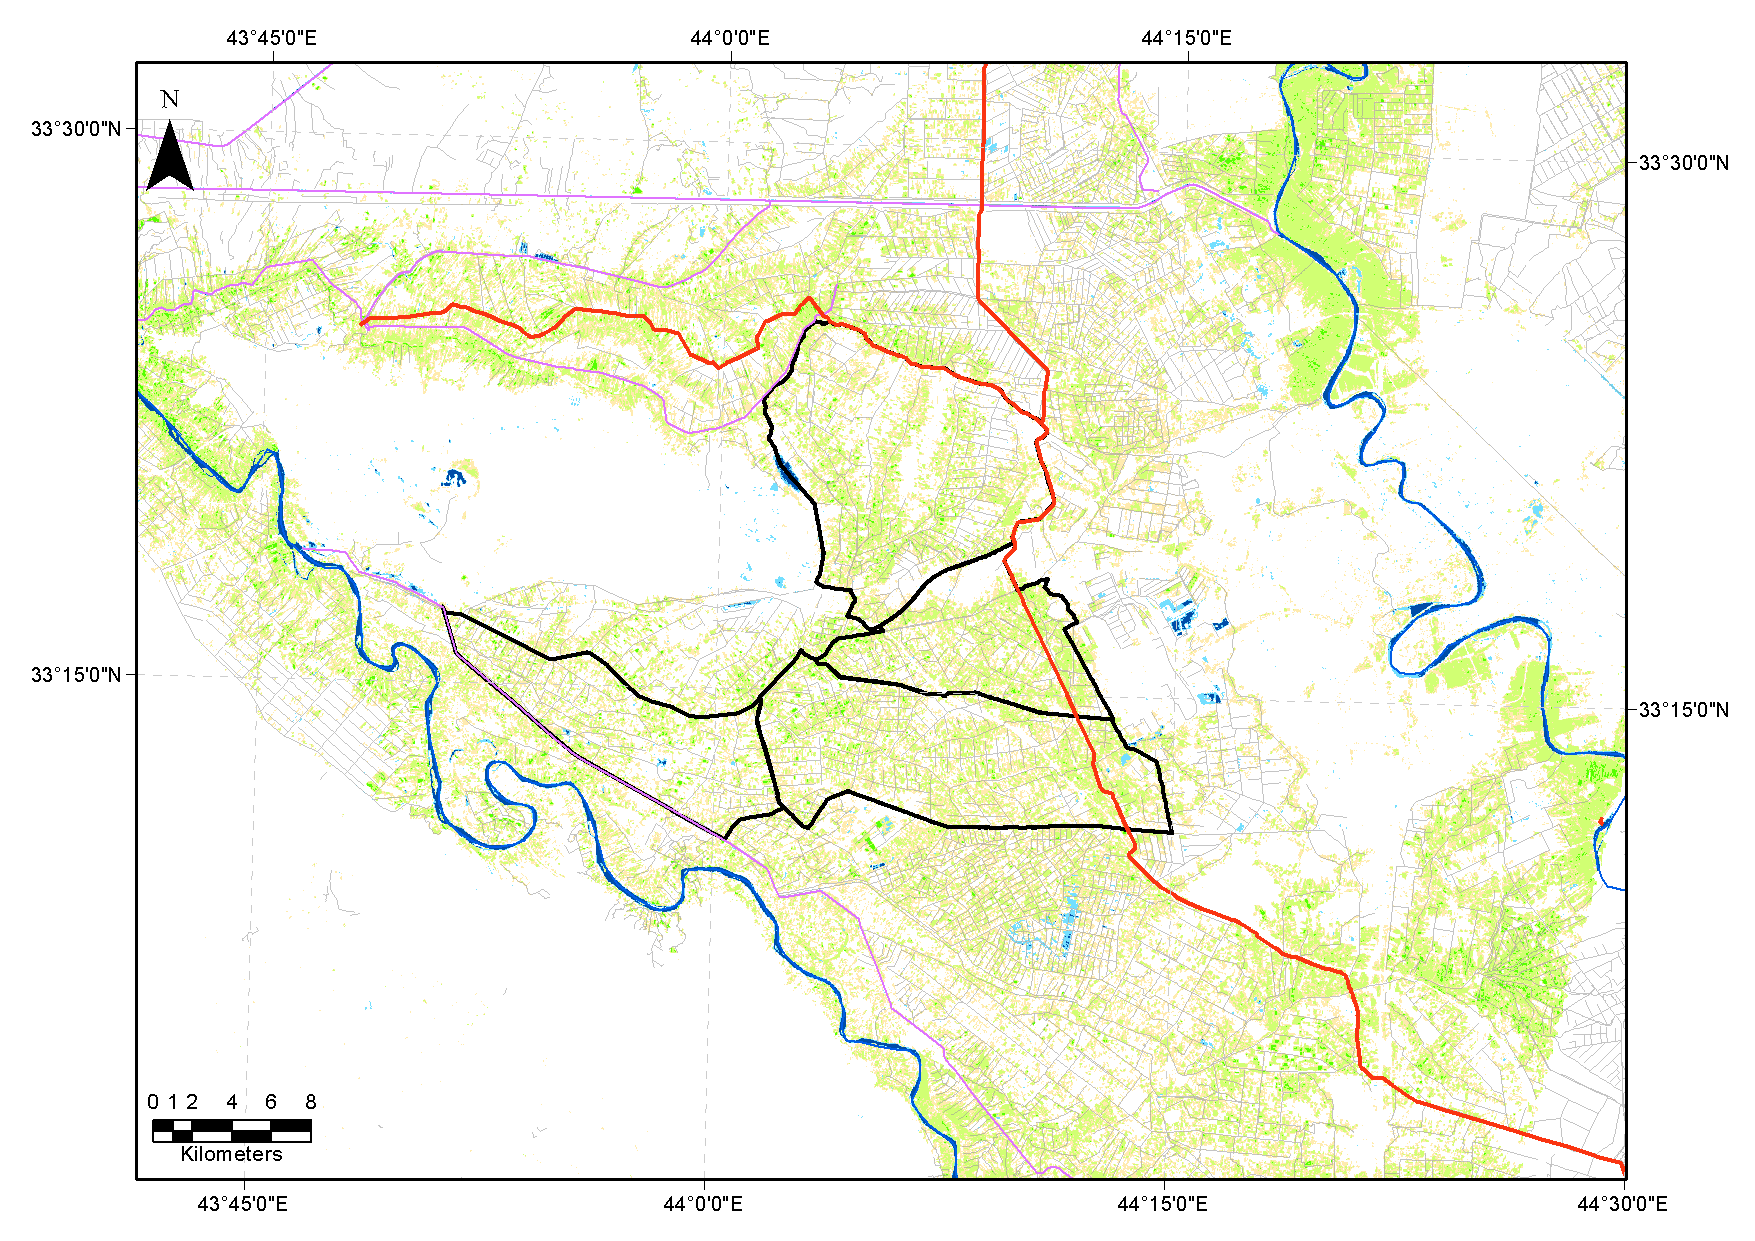
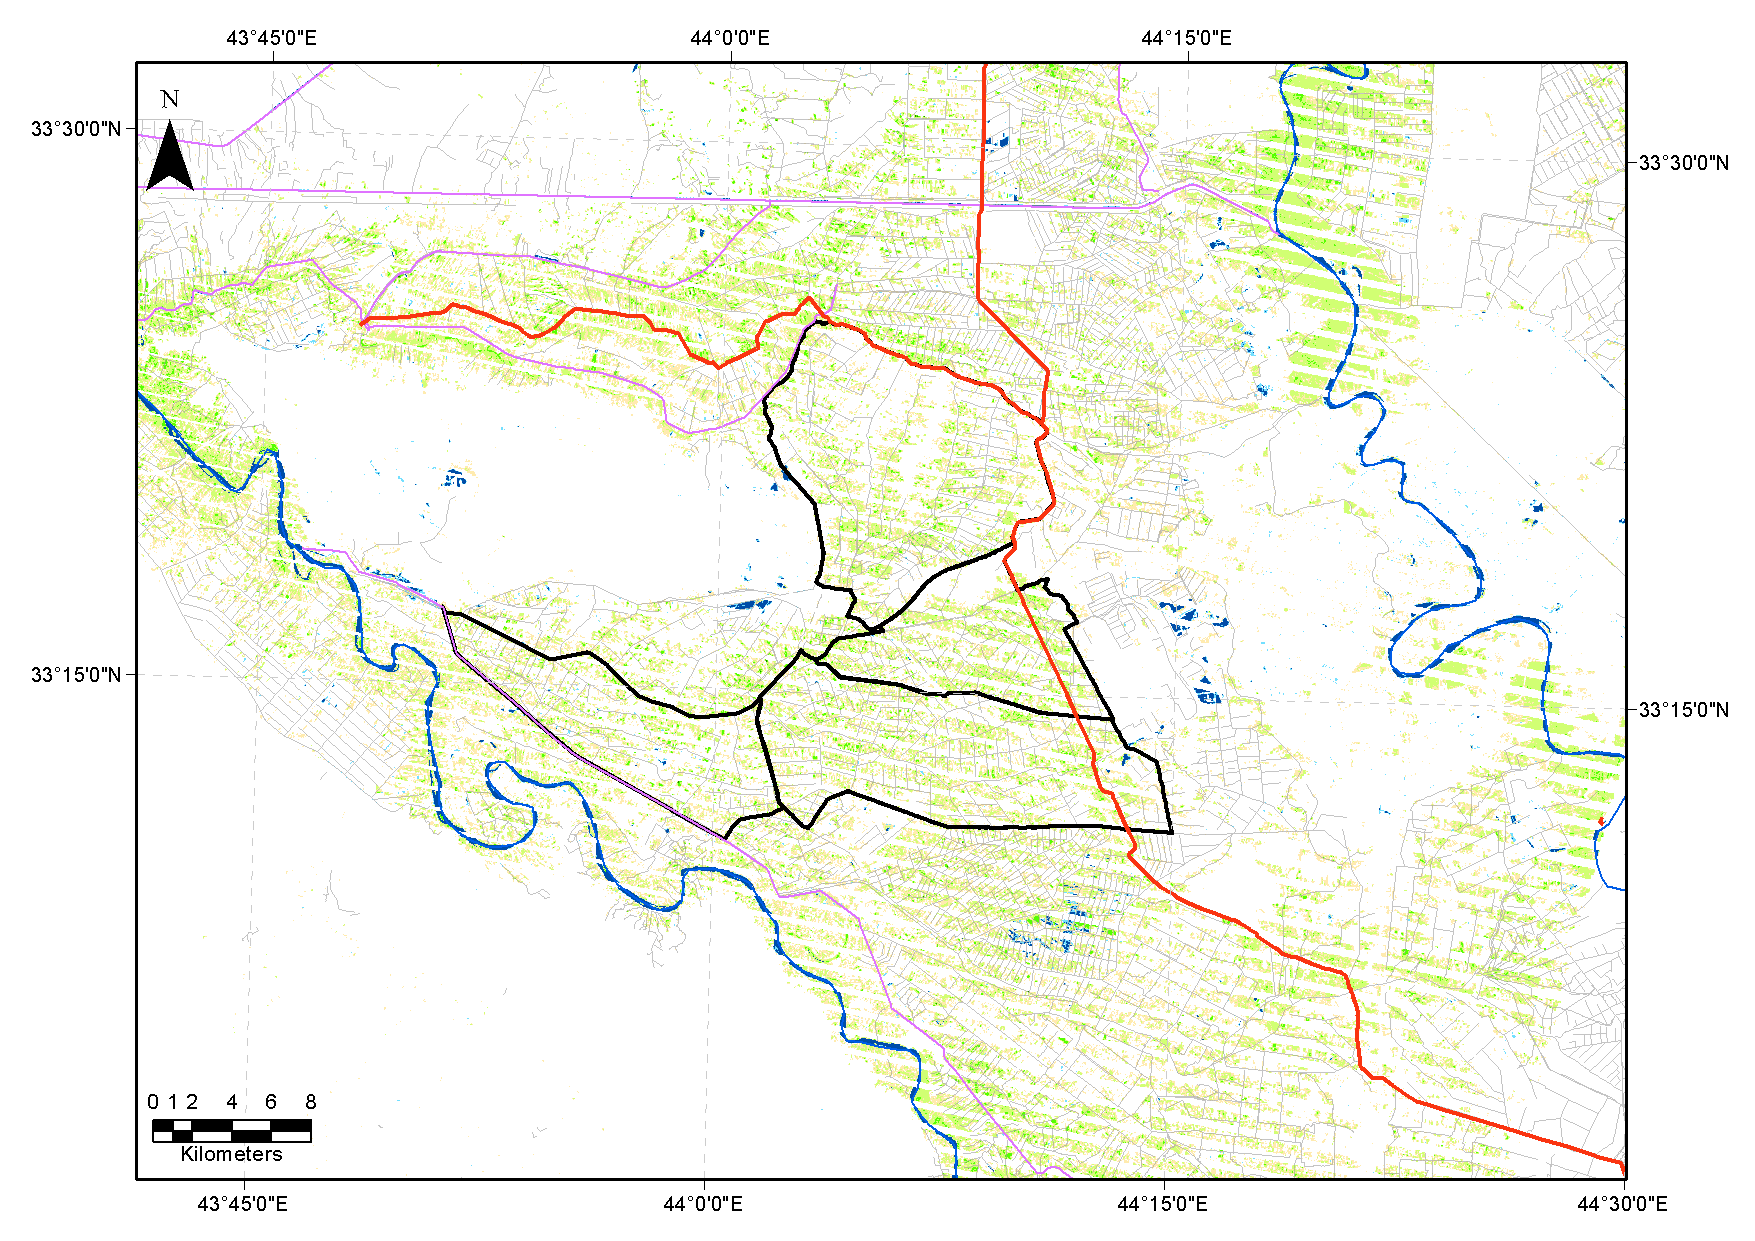
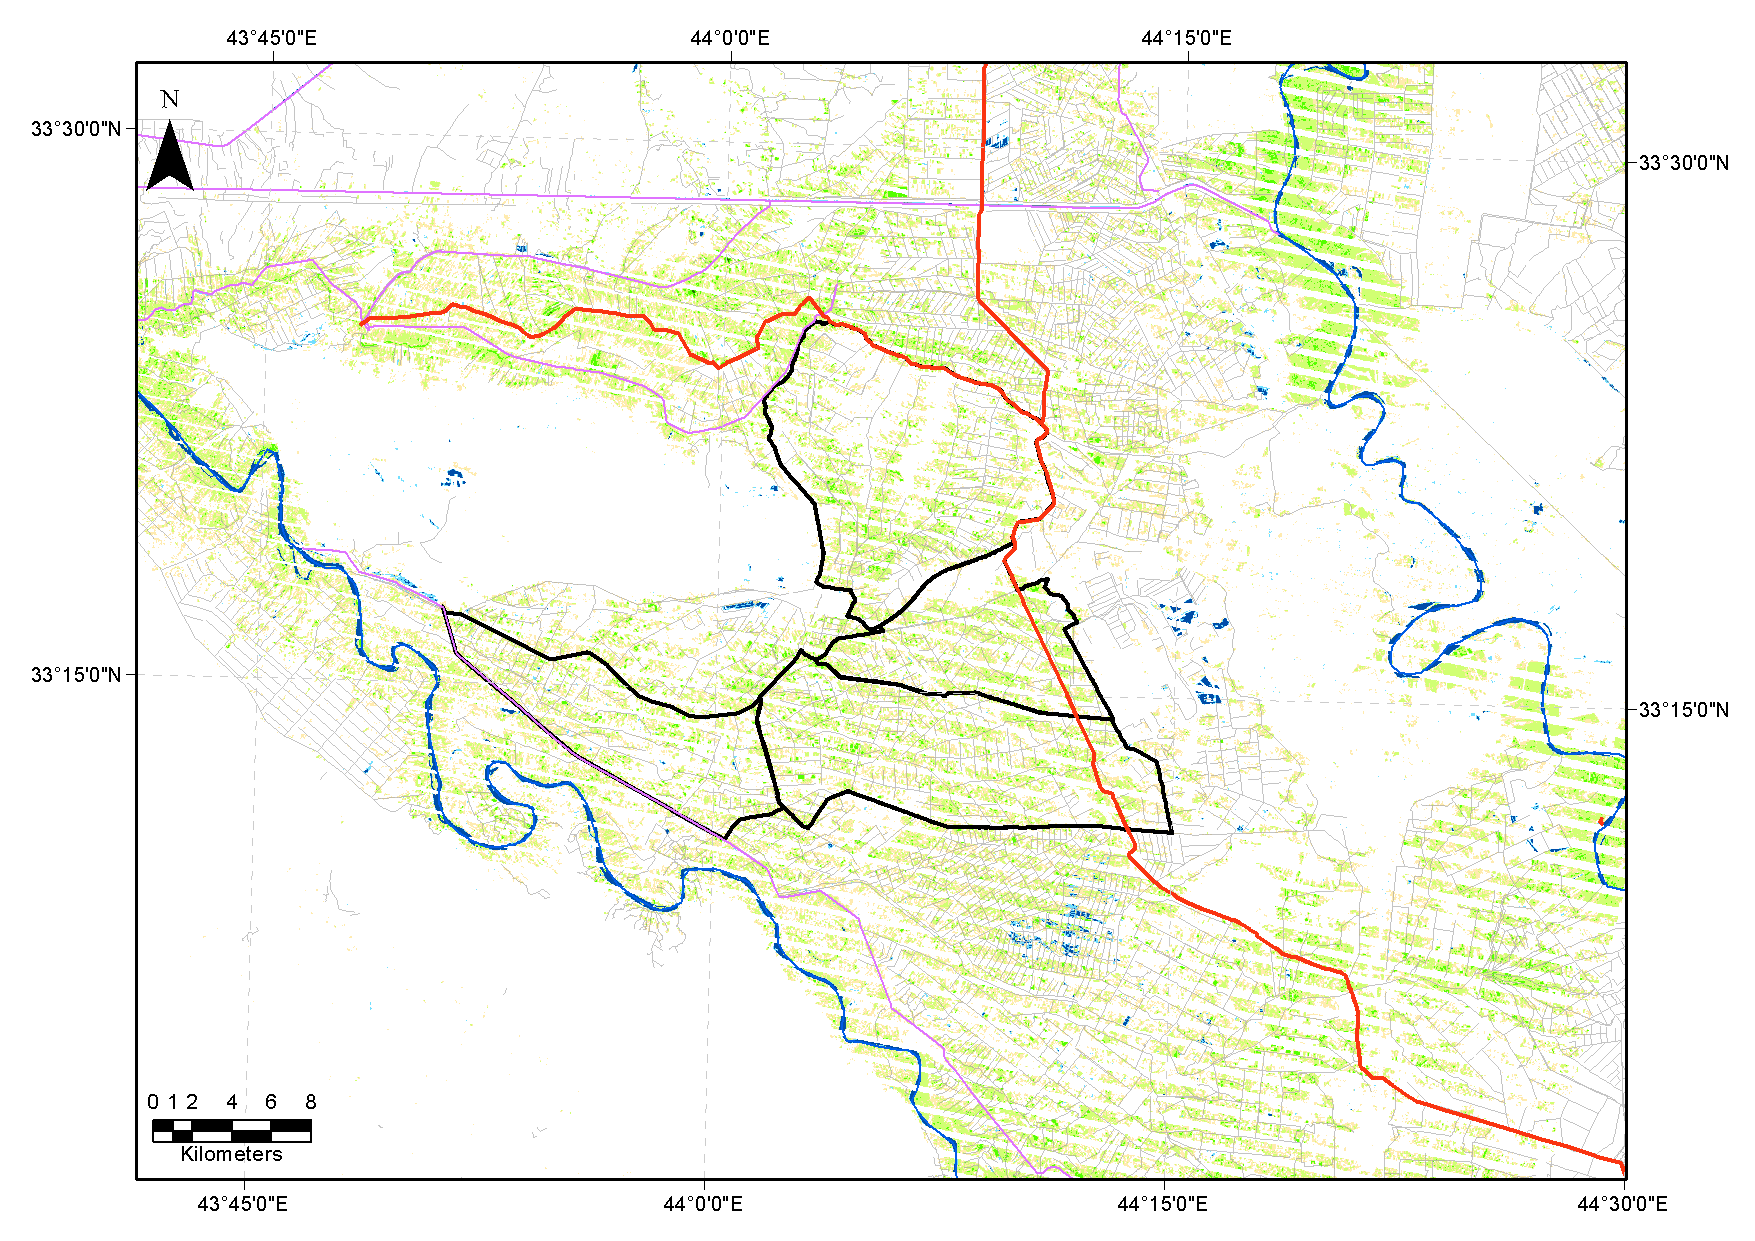
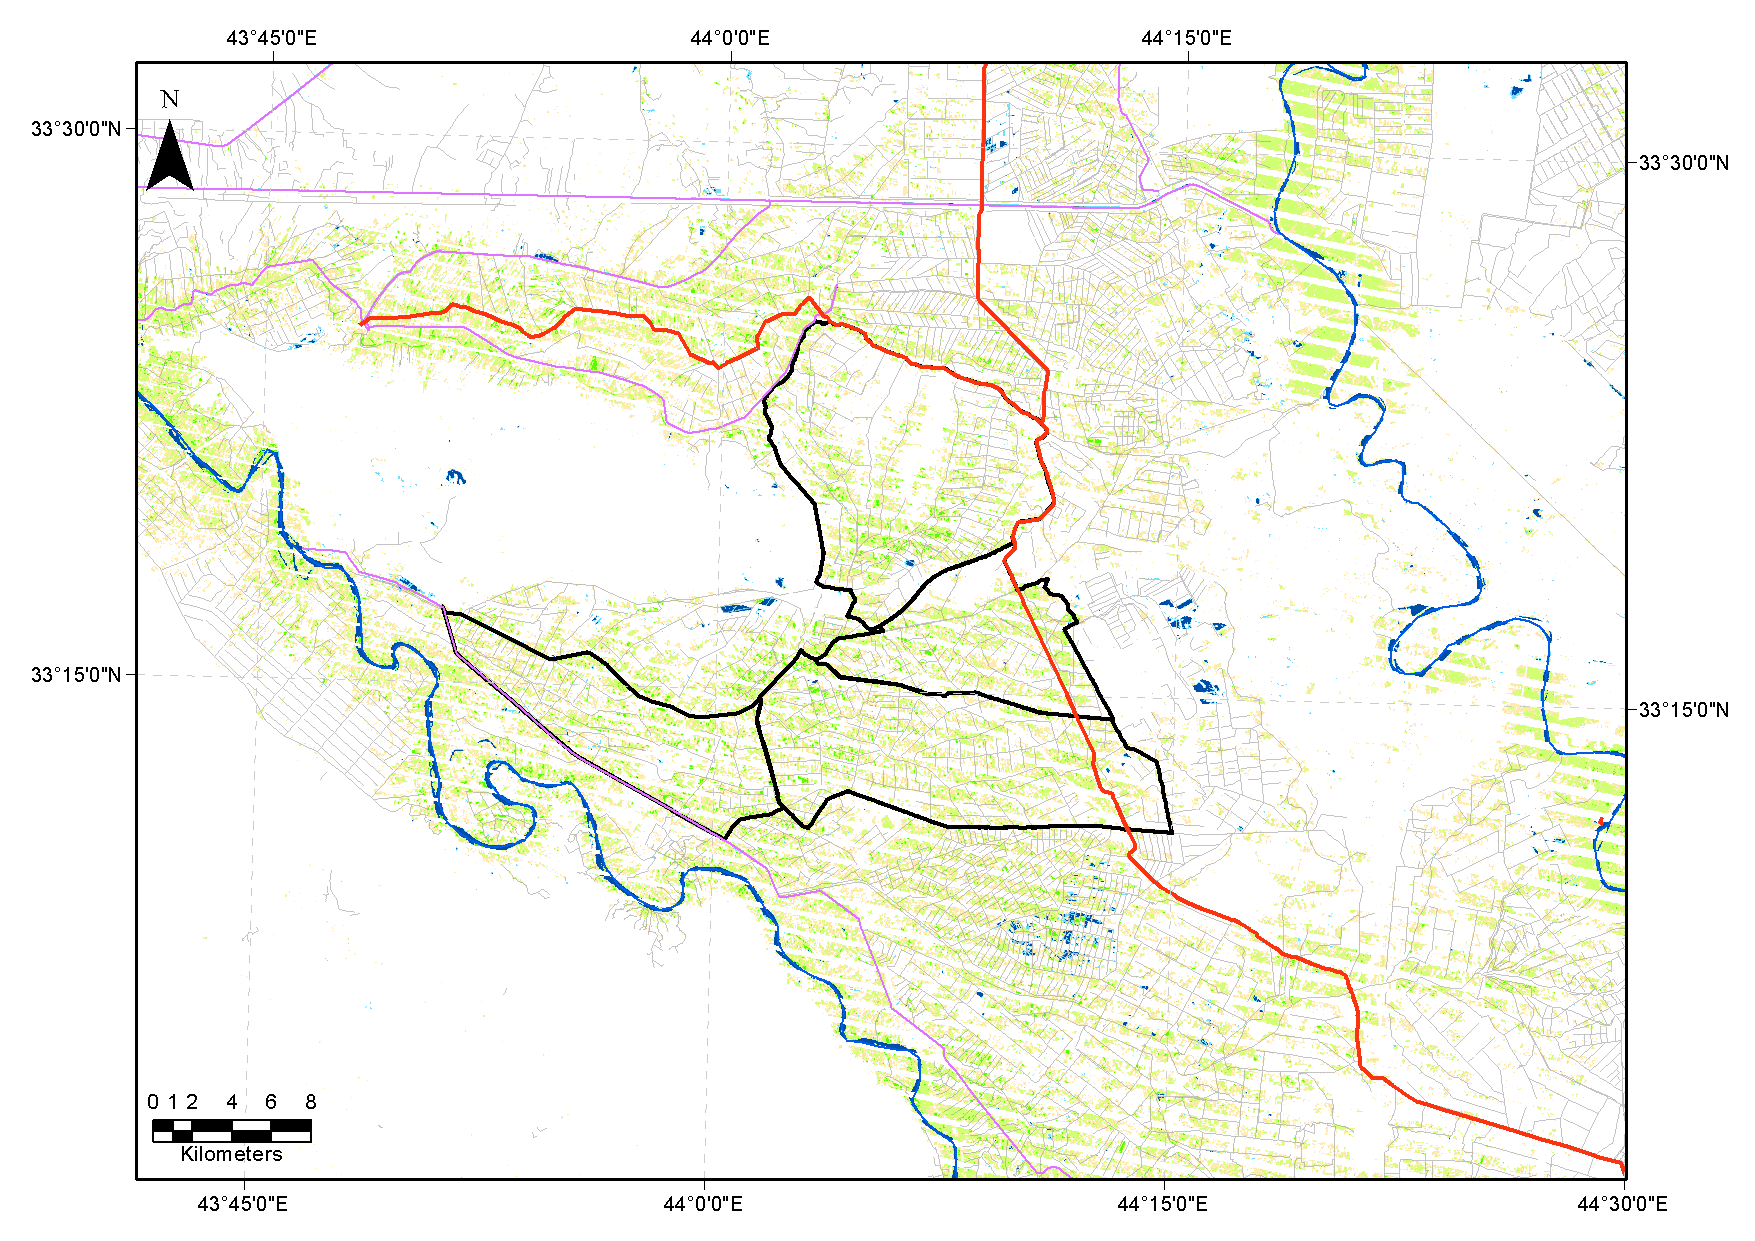
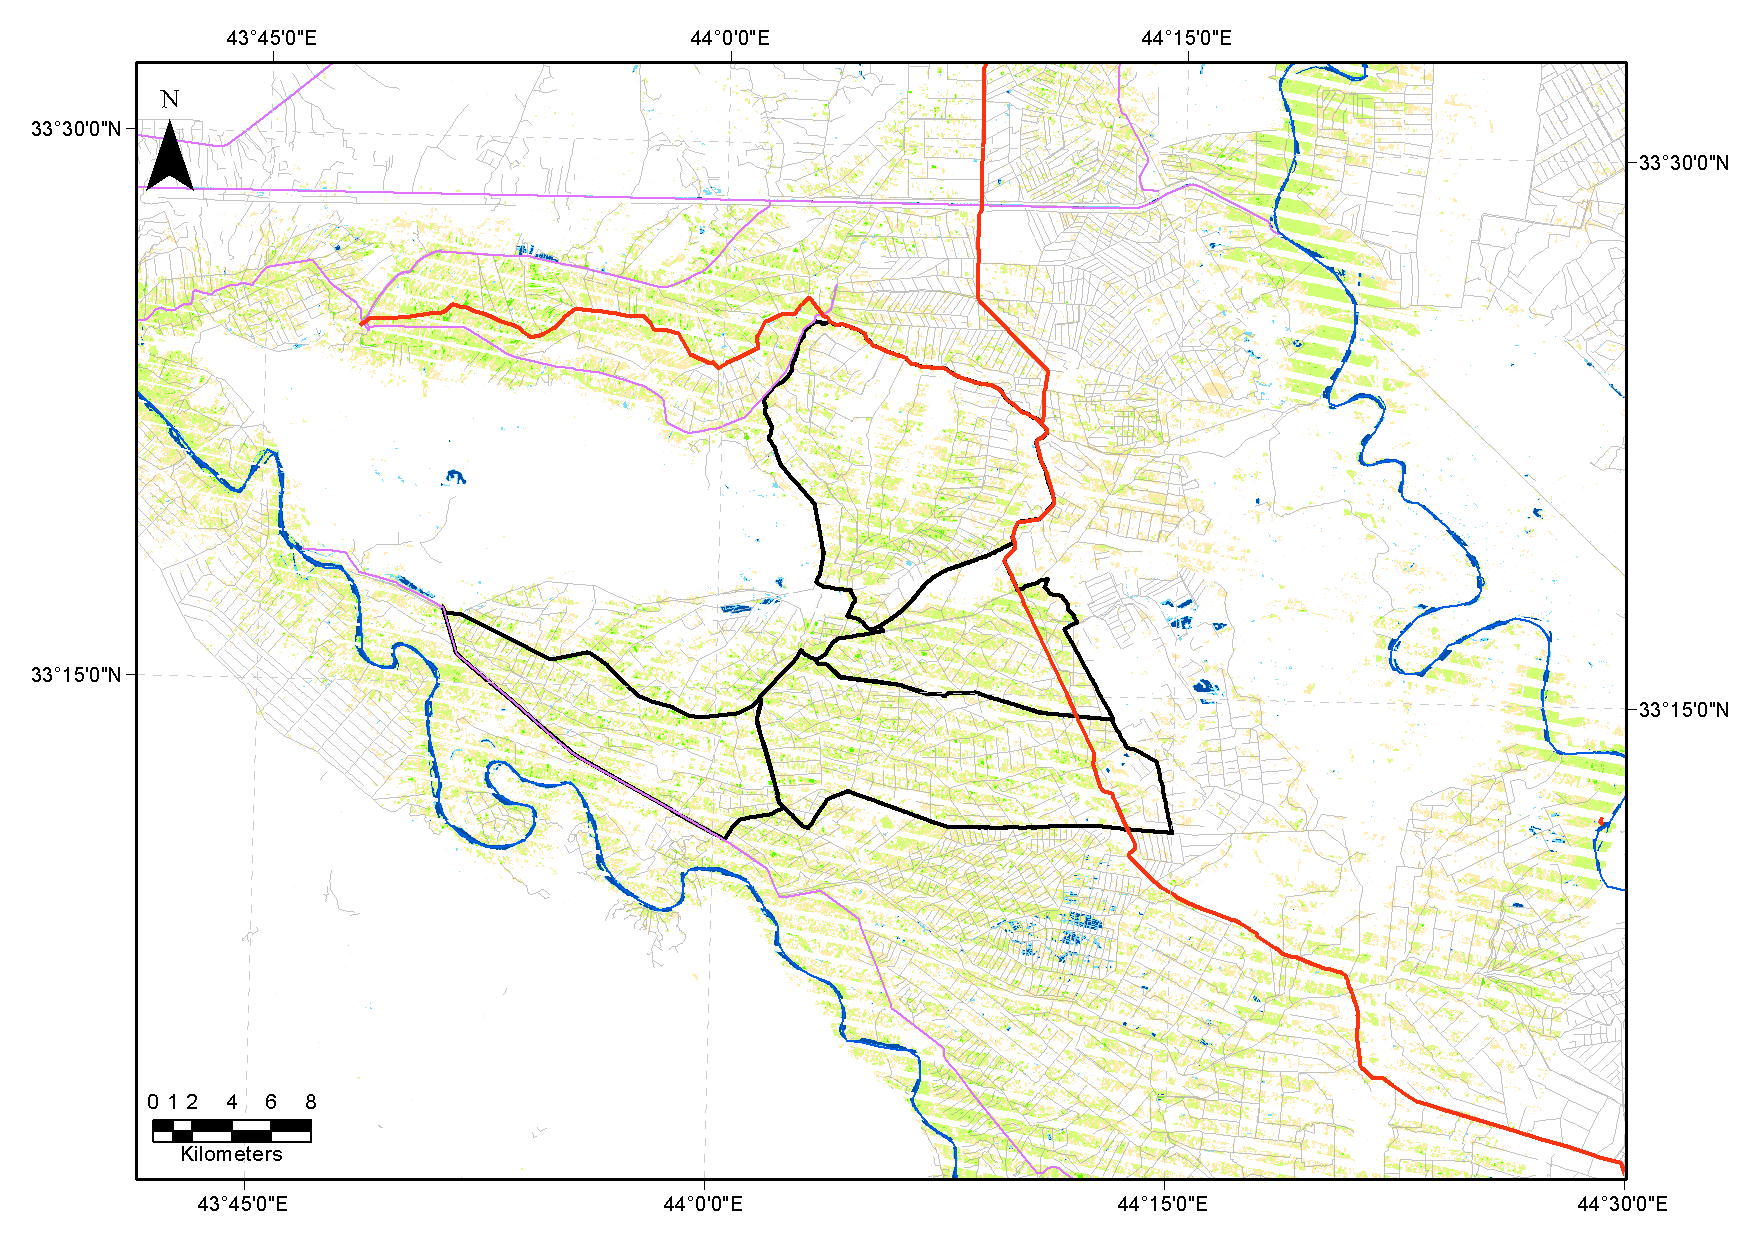
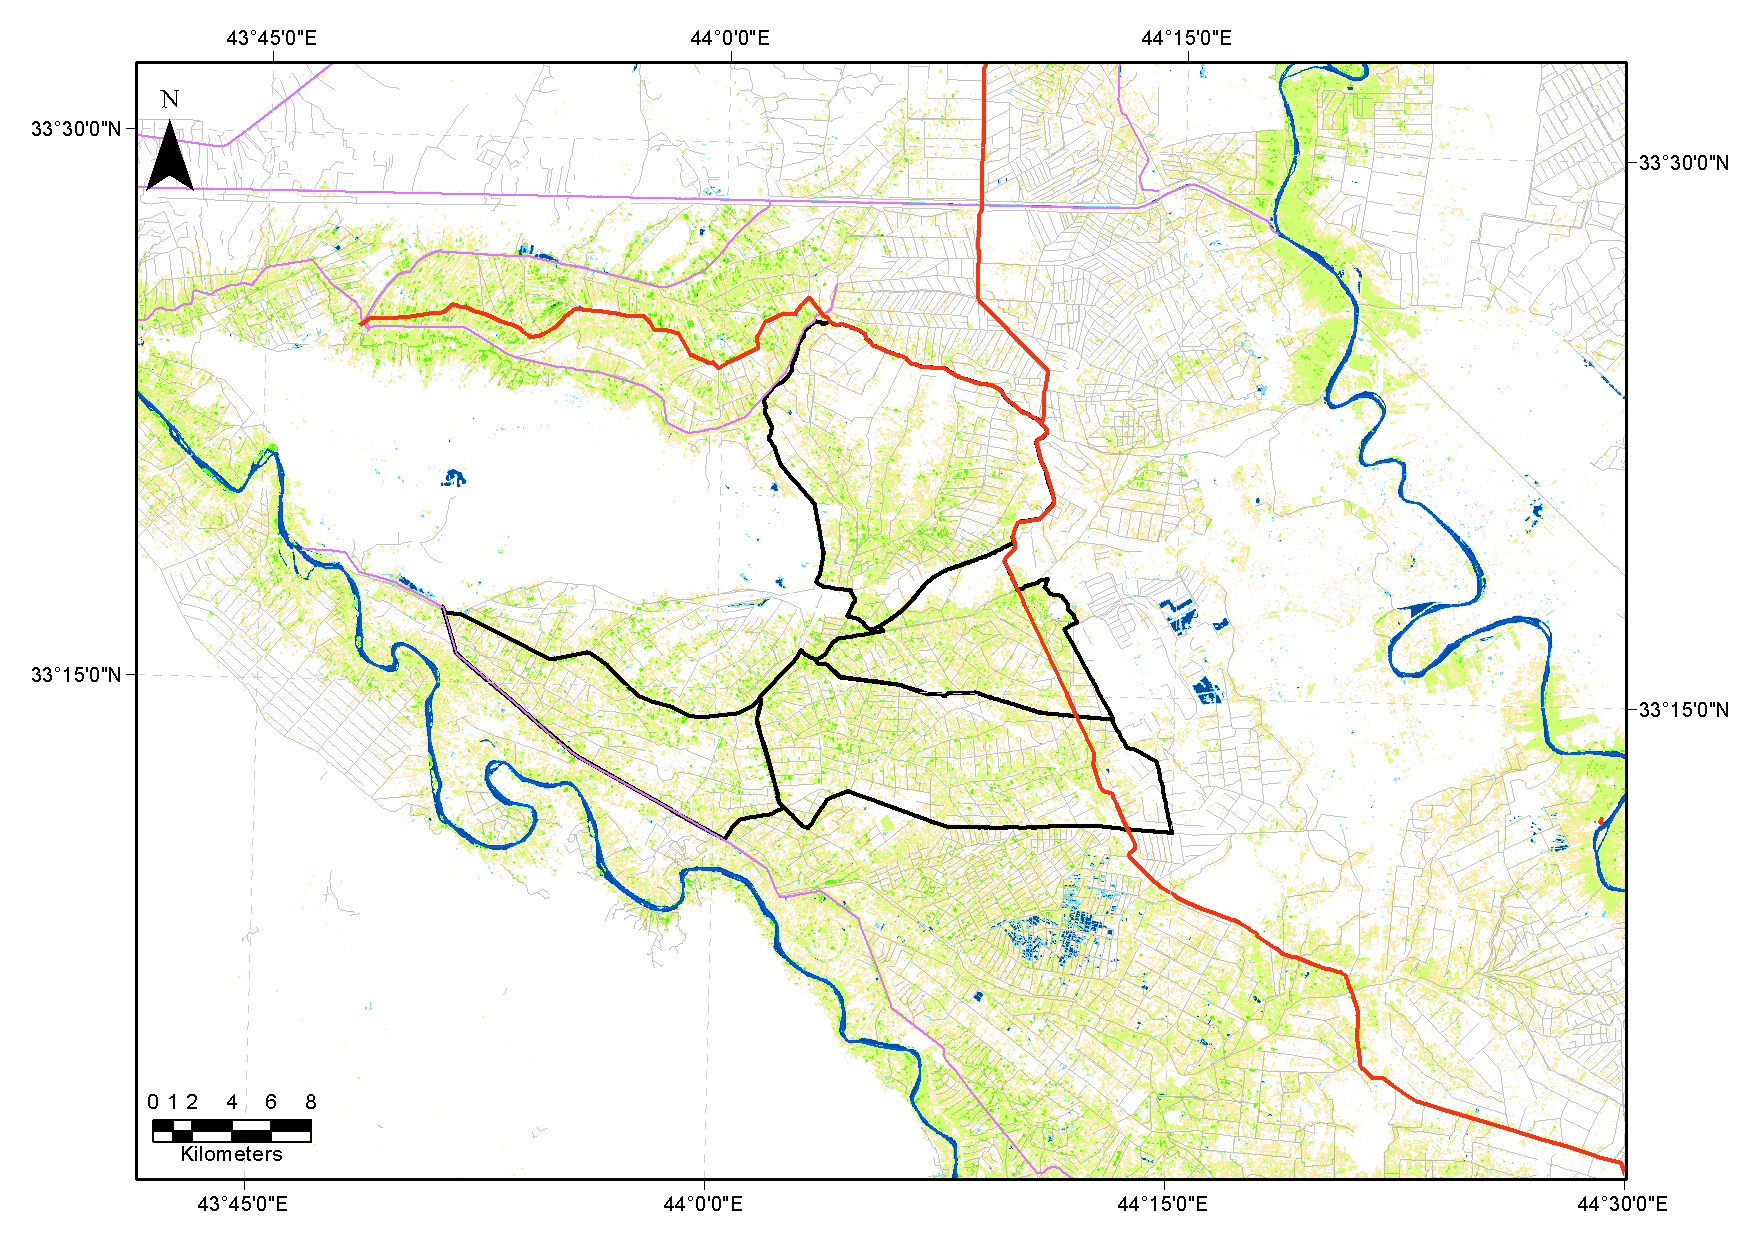
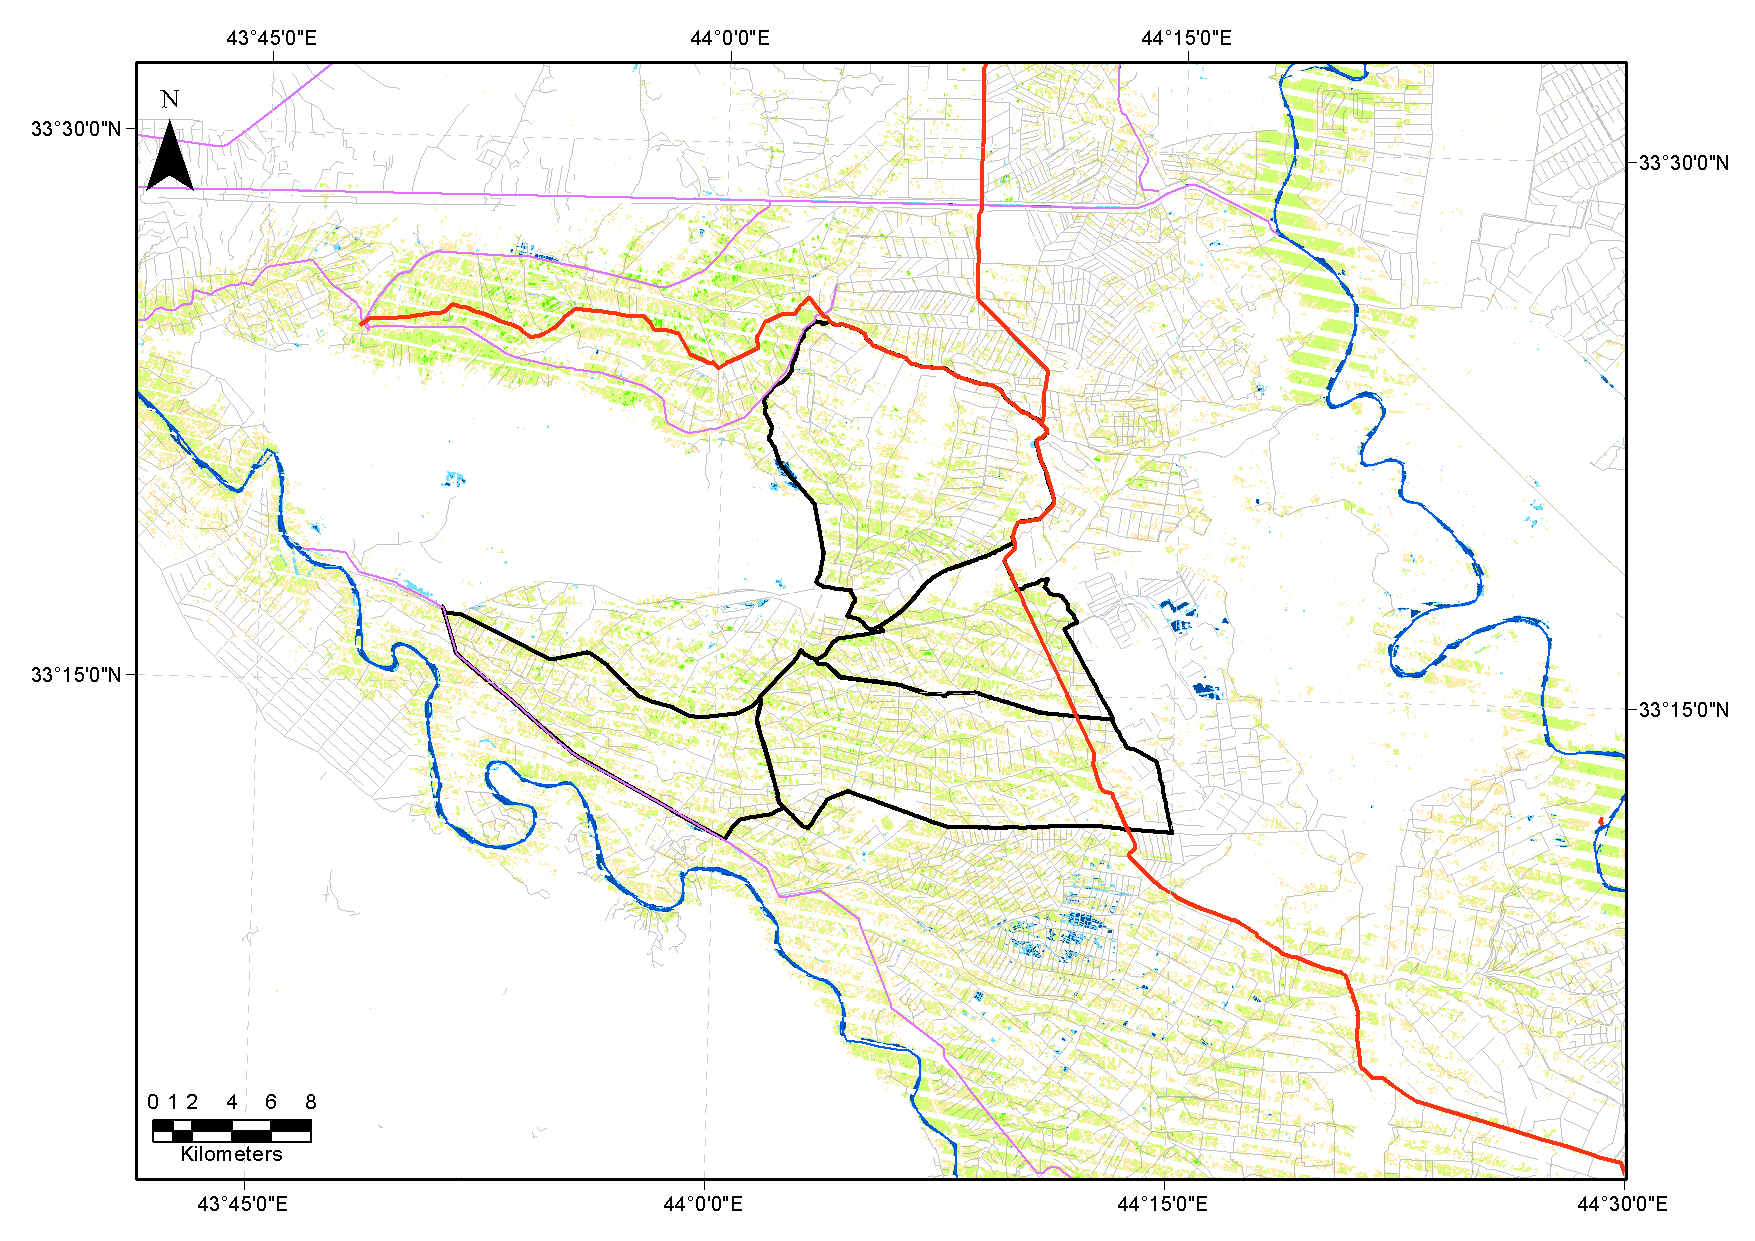
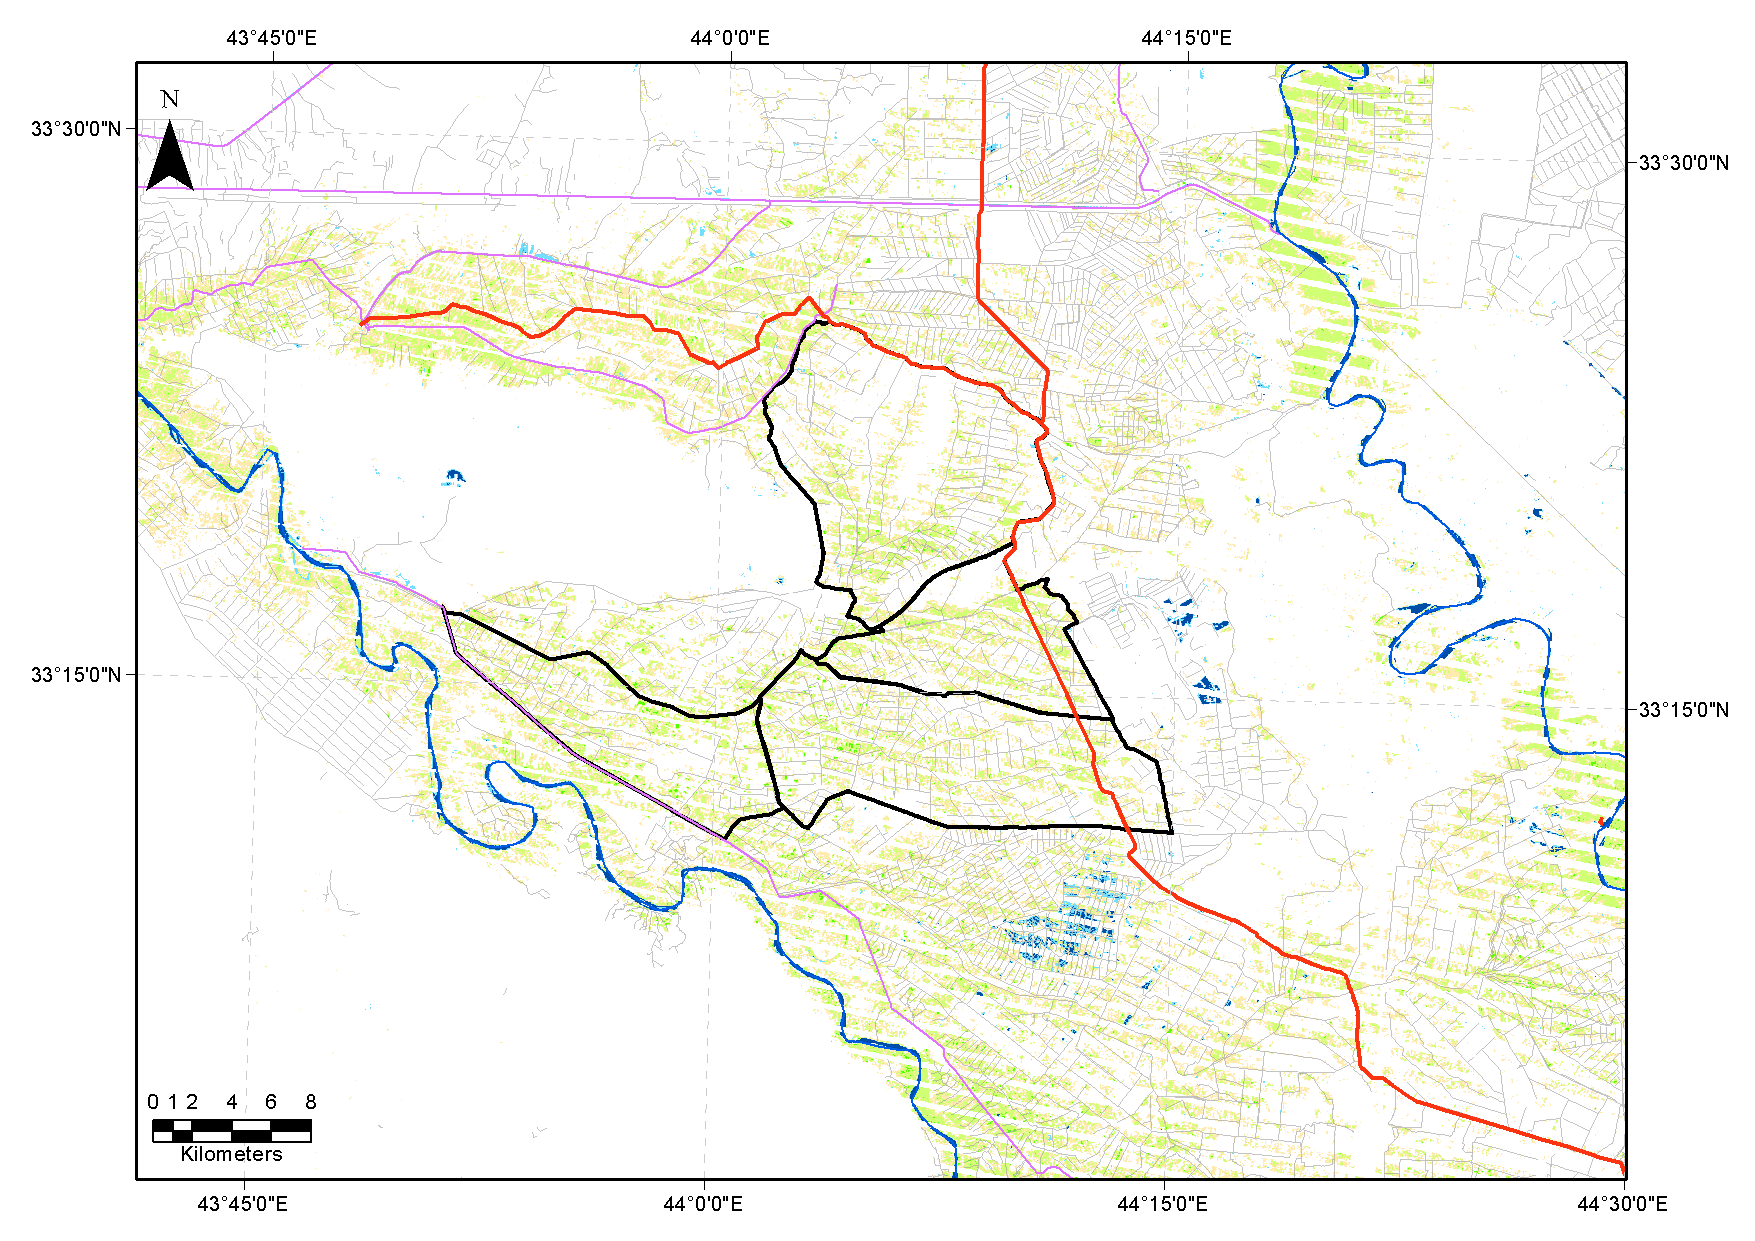
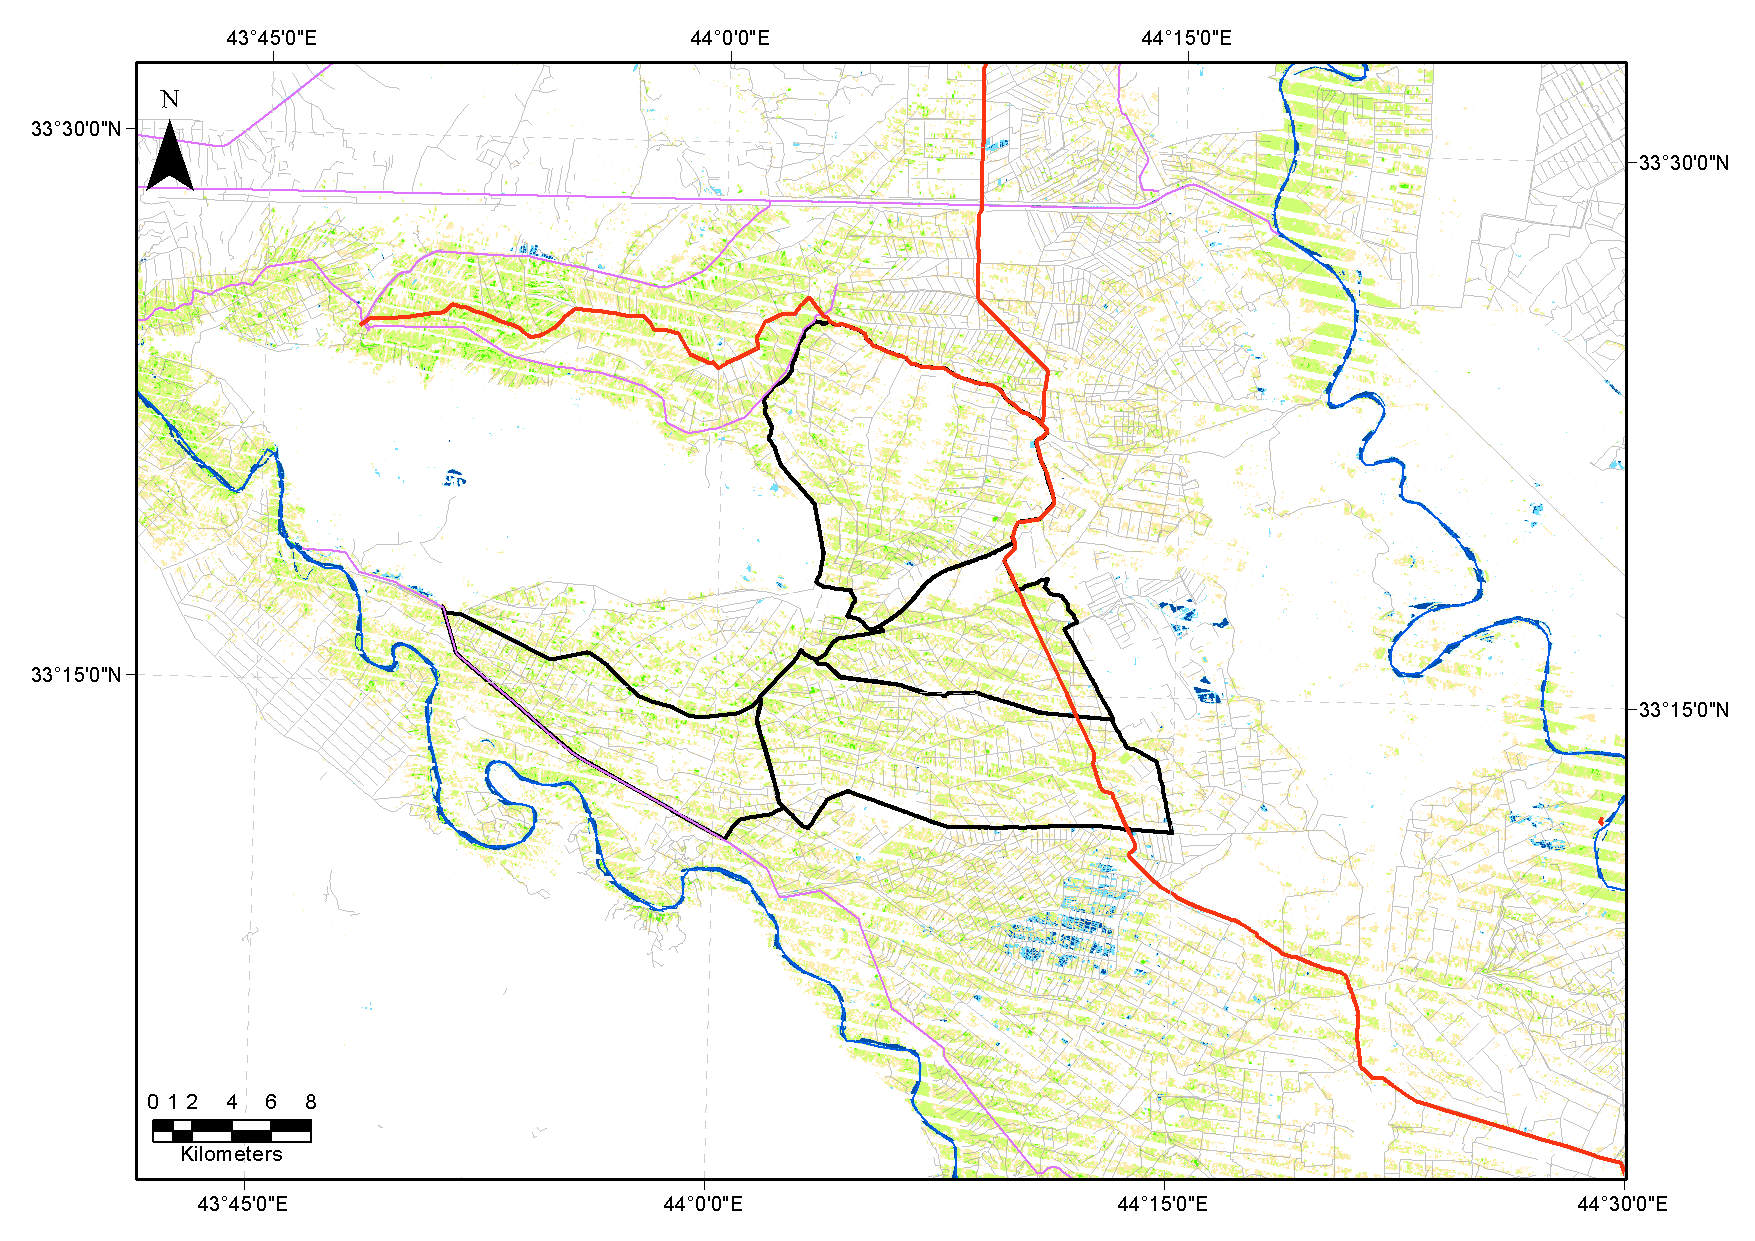
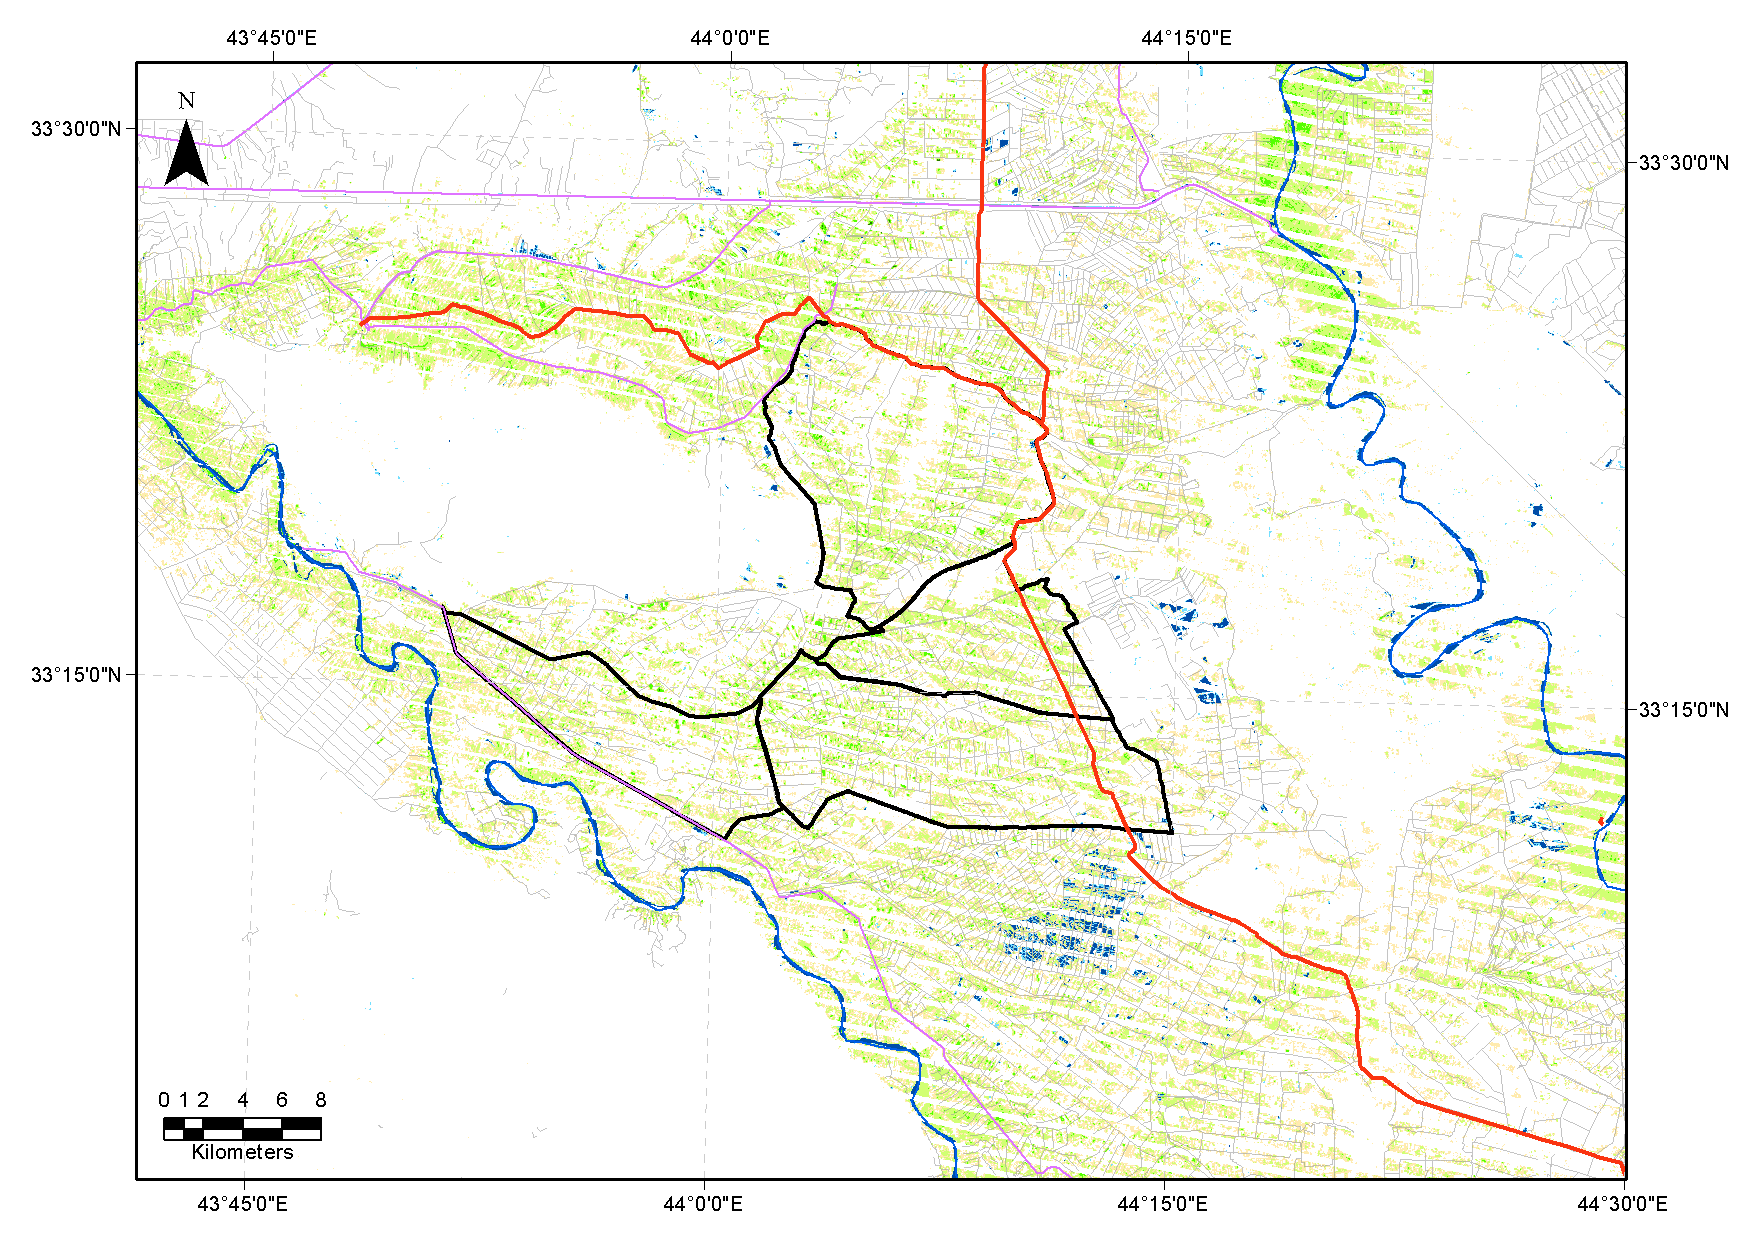
Abu Ghreib - Ag production between growing seasons:
Remote sensing analysis using Landsat TM and ETM data show the seasonal variation between years in the Abu Ghreib irrigation project.
Colors indicate the value of NDVI calculated based on corrected reflection data. Yellow/brown are values around 0.3-0.4,
while bright green indicate values around 0.6-0.7. Images were selected around September to allow a comparison at the same
time during the growing season. Note that images after 2003 have a scan-line problem, and part of the data set is missing.